
The Food Cost Gap Was Never About Cooking
Independent restaurants run at the same food cost percentage that chains have been improving for decades. The gap is not skill. It is intelligence. That distance is now closed.
Most independent restaurant owners know their food cost is higher than it should be. They see it every month, somewhere between 32 and 36 percent of revenue walking out the door in ingredients. They know it is too high. They know the chain two blocks away is running leaner.
What they often do not know is why. The food is better. The kitchen team works hard. The sourcing relationships are solid. But the chain hits 27 or 28 percent food cost almost every month, and the independent cannot get below 31, no matter how many conversations happen about waste and portion control.
The gap is not skill. It is not effort. It is not even sourcing. The chain has been running on business intelligence that the independent shop never had access to. Until this year.
What Chains Built Over Thirty Years
Large restaurant groups figured out demand forecasting in the 1990s. They built systems that tracked what sold, when it sold, and what made it sell more. Weather patterns. Local events. Day of week. School calendars. Seasonal shifts by neighborhood. Over time, those systems got very good at telling the kitchen how much to order on a Monday so that Friday ran smoothly and nothing expired on Sunday.
That intelligence compounded over thirty years. It got embedded into purchasing workflows, prep schedules, labor models, and menu decisions. A chain location in your market is not just a competitor. It is a thirty year head start on knowing exactly what to order, when to order it, and how much will be used before anything spoils.
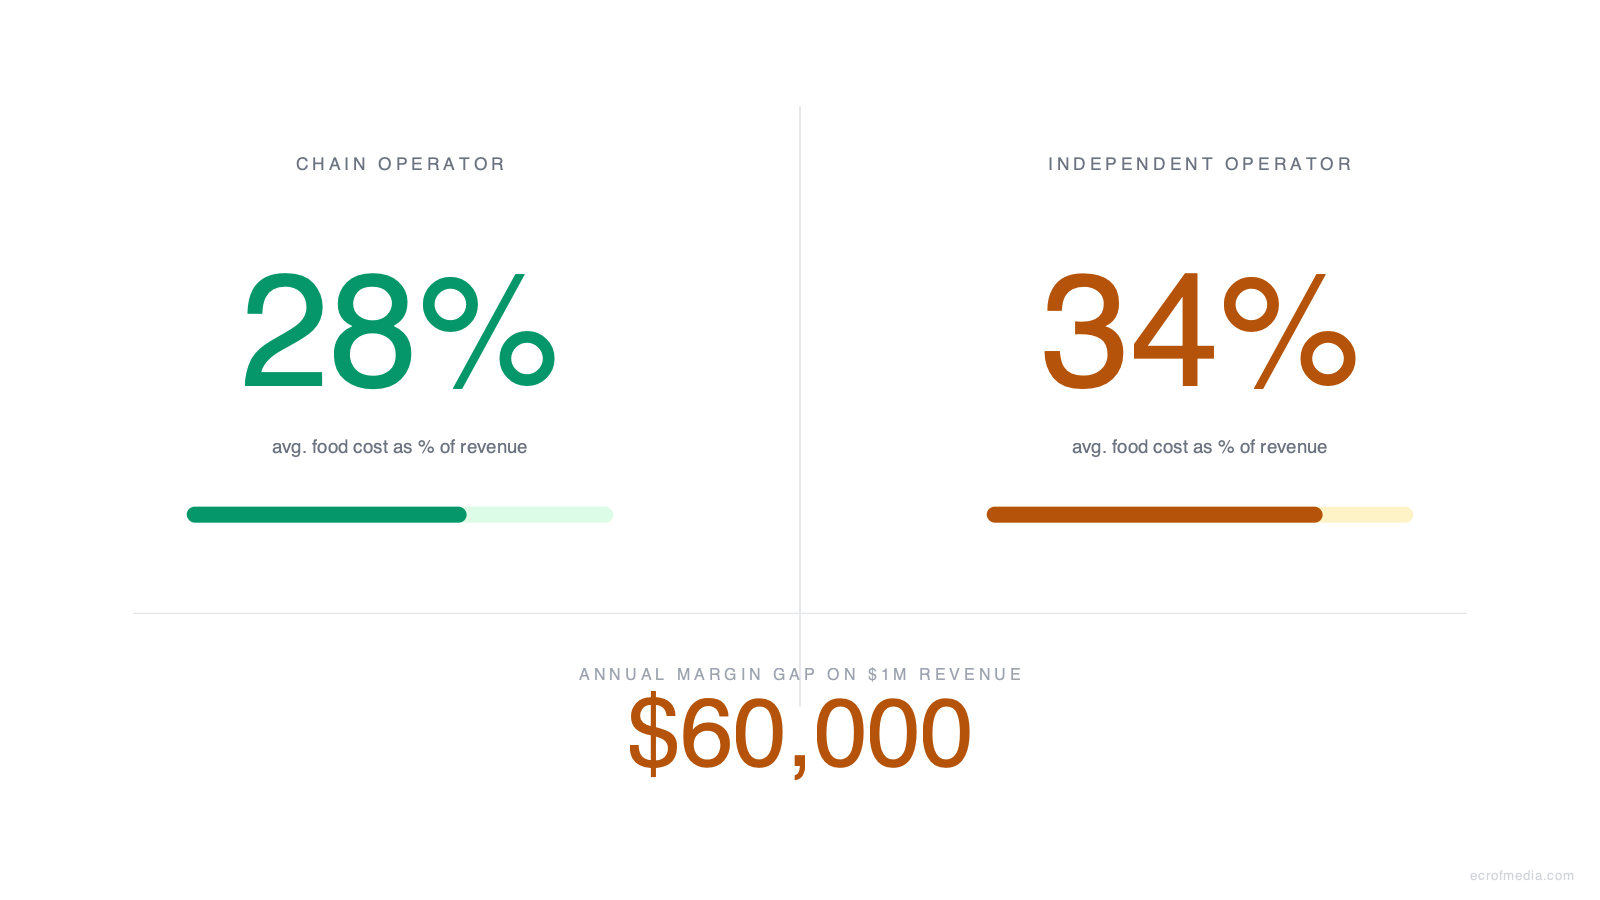
The result shows up directly in margin. Food costs for independent restaurants average 33 to 35 percent of revenue. Chain operators consistently hit 27 to 30 percent. On a restaurant doing one million dollars a year in sales, that five to seven percent difference is fifty to seventy thousand dollars. Not the result of better cooking. The result of better information.
The Four Layers That Move Together
The tools that close this gap are available now at a fraction of what enterprise restaurant groups have spent to build them. Not dashboards to stare at. Systems that wire the parts of the business together so the activity drives the decisions.
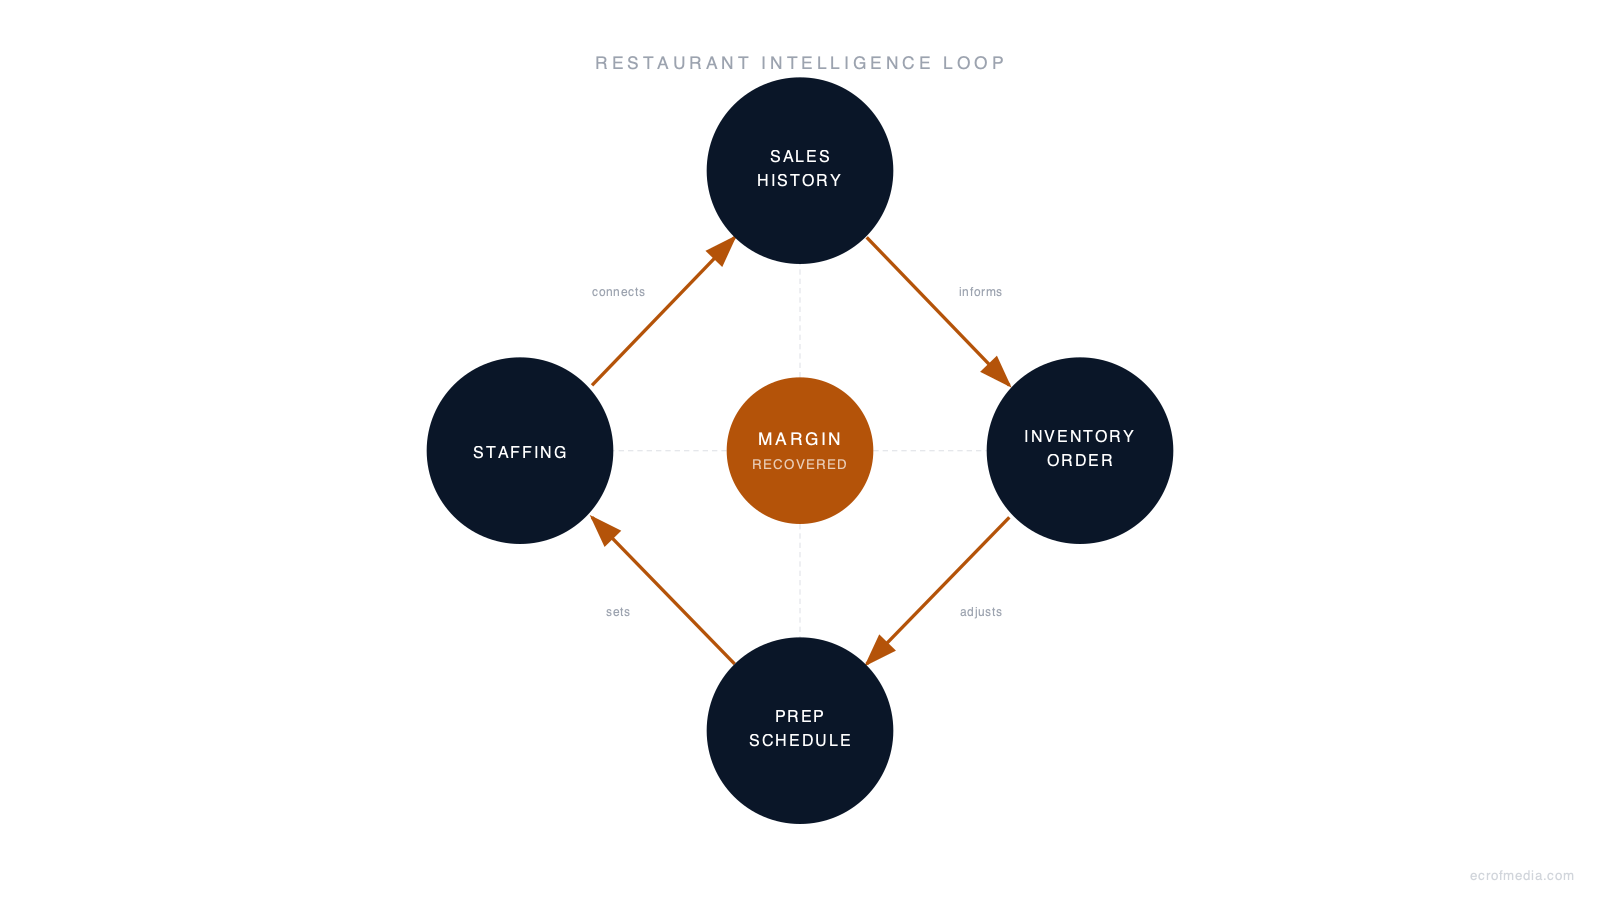
The framework that works has four connected layers.
- Sales history becomes the foundation. The system reads what sold last week, last month, and last year during comparable conditions. Not just total covers. Item level. The salmon sold twice as well on a rainy Thursday in March as it did the clear week before. That pattern is in the data. The new tools surface it without anyone having to find it manually.
- Demand signals connect to inventory ordering. When the forecast shows a high cover weekend, the purchase order adjusts before you think about it. When a slow week is coming, the order pulls back. The kitchen stops ordering based on what felt right last time and starts ordering based on what the data says this time will look like.
- Inventory connects to prep schedules. The kitchen team starts each day knowing what to prep and in what quantity, not from a clipboard estimate, but from the forecast. Waste drops not because the team is more careful, but because they are working from better information. You do not throw away food you never over prepped.
- Prep connects to staffing. When the system knows Thursday will be sixty covers and Saturday will be one hundred forty, the labor schedule shifts accordingly. Overtime drops. Coverage matches demand. Labor cost moves toward where it should be every single week instead of being corrected after the fact.
The four layers connect, and the business starts to move on its own data. Not one decision per layer requiring a separate manager conversation. One intelligence system updating all four simultaneously. This is what Built to Move looks like in a kitchen.
The chains did not win on cooking. They won because their kitchen ran on thirty years of compounded intelligence. That intelligence is now available to any operator who decides to install it.
What Twelve Months of Wiring Looks Like
A forty seat Italian restaurant in a neighborhood commercial corridor started connecting these layers about a year ago. The owner had run the shop for nine years. Good reputation. Loyal regulars. A food cost that stayed at 34 percent no matter what she adjusted.
The first step was connecting the point of sale history to an inventory system. Within ninety days, her food cost moved from 34 to 30 percent. The systems identified three consistent over ordering patterns she had never seen from inside the kitchen. Every Tuesday she was ordering enough salmon for a busy weekend even when the data showed a slow one was coming. Every spring she was over prepping the mushroom dish because March had been strong three years earlier, but her neighborhood had shifted and March foot traffic had declined by 18 percent. Small patterns. Compounding loss. Every week.
By month four, inventory connected to her prep schedule. The kitchen team stopped spending the first hour of every morning deciding what to prep. The list was ready when they arrived, built from what the system predicted the next three days would look like based on reservations, historical patterns, and the current forecast. Kitchen prep time dropped by forty minutes per shift. That is not a small number when two prep cooks are clocked in by seven in the morning.
By month eight, staffing connected to reservations and the demand model. Saturday coverage now adjusted automatically based on what the system expected, not what the manager guessed on Thursday afternoon. The three times in the prior year she had overstaffed a slow Saturday stopped happening. The one time she had underprepared for a busy Sunday brunch also stopped happening.
By month twelve, her food cost was 28.4 percent. On a restaurant doing 1.1 million dollars in annual revenue, the difference between 34 percent and 28 percent is sixty six thousand dollars. The kitchen had not gotten better at cooking. The business had gotten wired.
The Numbers on the Wire
Restaurants that connect inventory and demand systems reduce food waste by an average of 26 percent and over ordering by 31 percent. For a restaurant doing between one million and two million in annual revenue, that translates to between eighteen thousand and forty five thousand dollars in recovered margin per year. The first year cost to install the system runs four thousand to twelve thousand dollars. The payback period is typically under ninety days.
The Business Is Not Just the Kitchen
The intelligence connects more than purchasing and prep. When your front of house team knows which specials are surplus items that need to move, their upsell becomes your waste management. When your purchase orders connect to your accounting, your weekly profit and loss reflects actual cost in real time instead of estimated cost at month end. When your staffing connects to your reservation flow, your managers stop making coverage calls from instinct and start making them from a model that has already seen this exact week before.
Sales, operations, finance, and staffing all touch the same intelligence. The activity of the business, the covers on the books, the items moving through the kitchen, the purchase orders placed at two in the morning, drives the decisions that used to require the owner in the room at every turn.
One win is never just in purchasing. When the kitchen stops guessing on prep, the front of house starts presenting with more confidence. When the front of house pushes surplus specials effectively, purchasing adjusts next week. When purchasing adjusts, finance sees the actual cost picture earlier. The parts move together, and the owner sees what the business actually is instead of managing what it might be doing.
One win is never just in one department. When the intelligence layer connects all four, the activity of the business starts driving the operation. That is the shift from owner operated to Built to Move.
The Next Level
The connected system described above runs on configured tools. You set up the integrations, build the forecast logic, and wire the layers. That alone closes most of the gap. The Autonomy Layer takes it one step further.
Routine decisions inside the system, what to order this week, when to adjust prep quantities for a weather shift, how to redistribute coverage across a holiday weekend, act on their own inside the rules the owner sets. The owner is not removed from decisions. The decisions that do not require her judgment stop asking for it. The ones that do surface clearly, at the right time, with the right context, and with a recommended action already prepared.
Ecrof can install and run the Autonomy Layer as a service. Most restaurant owners do not have the bandwidth to build this architecture across purchasing, prep, staffing, and finance simultaneously while running service every night. We build it, configure it to the specific operation, and hand it over running. The kitchen reads itself.
The Brain Map is where this starts. It maps what the business currently knows, where the intelligence gaps are, and which layer is leaking the most margin. Most restaurant owners come out of it knowing exactly what to wire first and what it is worth to do it. If you have been watching your food cost and wondering where the gap lives, the map shows you.
See this in your own business.
We run a live workshop where we walk through exactly where your business intelligence is accessible and where it is still trapped. You will leave with a clear picture of what needs to be packaged first.
Join the Live Workshop